FCP - FortiAnalyzer 7.4 Analyst Questions and Answers
Refer to Exhibit:
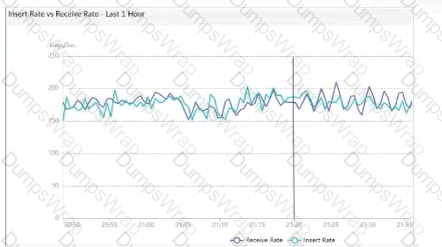
What does the data point at 21:20 indicate?
Options:
FortiAnalyzer is indexing logs faster than logs are being received.
The fortilogd daemon is ahead in indexing by one log.
The SQL database requires a rebuild because of high receive lag.
FortiAnalyzer is temporarily buffering received logs so older logs can be indexed first.
Answer:
AExplanation:
The exhibit shows a graph that tracks two metrics over time: Receive Rate and Insert Rate. These two rates are crucial for understanding the log processing behavior in FortiAnalyzer.
Understanding Receive Rate and Insert Rate:
Receive Rate: This is the rate at which FortiAnalyzer is receiving logs from connected devices.
Insert Rate: This is the rate at which FortiAnalyzer is indexing (inserting) logs into its database for storage and analysis.
Data Point at 21:20:
At 21:20, the Insert Rate line is above the Receive Rate line, indicating that FortiAnalyzer is inserting logs into its database at a faster rate than it is receiving them. This situation suggests that FortiAnalyzer is able to keep up with the incoming logs and is possibly processing a backlog or temporarily received logs faster than new logs are coming in.
Option Analysis:
Option A - FortiAnalyzer is Indexing Logs Faster Than Logs are Being Received: This accurately describes the scenario at 21:20, where the Insert Rate exceeds the Receive Rate. This indicates that FortiAnalyzer is handling logs efficiently at that moment, with no backlog in processing.
Option B - The fortilogd Daemon is Ahead in Indexing by One Log: The data does not provide specific information about the fortilogd daemon’s log count, only the rates. This option is incorrect.
Option C - SQL Database Requires a Rebuild: High receive lag would imply a backlog in receiving and indexing logs, typically visible if the Receive Rate were significantly above the Insert Rate, which is not the case here.
Option D - FortiAnalyzer is Temporarily Buffering Logs to Index Older Logs First: There is no indication of buffering in this scenario. Buffering would usually occur if the Receive Rate were higher than the Insert Rate, indicating that FortiAnalyzer is storing logs temporarily due to indexing lag.
Conclusion:
Correct Answer: A. FortiAnalyzer is indexing logs faster than logs are being received.
The graph at 21:20 shows a higher Insert Rate than Receive Rate, indicating efficient log processing by FortiAnalyzer.
References:
FortiAnalyzer 7.4.1 documentation on log processing metrics, Receive Rate, and Insert Rate indicators.
Exhibit.
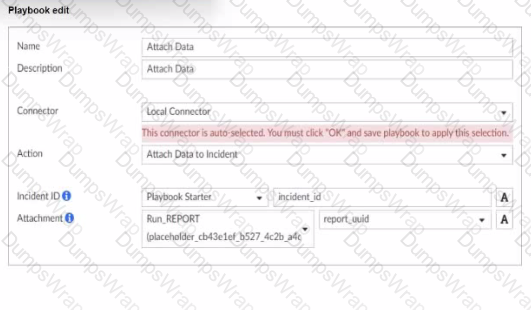
What is the analyst trying to create?
Options:
The analyst is trying to create a trigger variable to the used in the playbook.
The analyst is trying to create an output variable to be used in the playbook.
The analyst is trying to create a report in the playbook.
The analyst is trying to create a SOC report in the playbook.
Answer:
BExplanation:
In the exhibit, the playbook configuration shows the analyst working with the "Attach Data" action within a playbook. Here’s a breakdown of key aspects:
Incident ID: This field is linked to the "Playbook Starter," which indicates that the playbook will attach data to an existing incident.
Attachment: The analyst is configuring an attachment by selecting Run_REPORT with a placeholder ID for report_uuid. This suggests that the report’s UUID will dynamically populate as part of the playbook execution.
Analysis of Options:
Option A - Creating a Trigger Variable:
A trigger variable would typically be set up in the playbook starter or initiation configuration, not within the "Attach Data" action. The setup here does not indicate a trigger, as it’s focusing on data attachment.
Conclusion: Incorrect.
Option B - Creating an Output Variable:
The field Attachment with a report_uuid placeholder suggests that the analyst is defining an output variable that will store the report data or ID, allowing it to be attached to the incident. This variable can then be referenced or passed within the playbook for further actions or reporting.
Conclusion: Correct.
Option C - Creating a Report in the Playbook:
While Run_REPORT is selected, it appears to be an attachment action rather than a report generation task. The purpose here is to attach an existing or dynamically generated report to an incident, not to create the report itself.
Conclusion: Incorrect.
Option D - Creating a SOC Report:
Similarly, this configuration is focused on attaching data, not specifically generating a SOC report. SOC reports are generally predefined and generated outside the playbook.
Conclusion: Incorrect.
Conclusion:
Correct Answer: B. The analyst is trying to create an output variable to be used in the playbook.
The setup allows the playbook to dynamically assign the report_uuid as an output variable, which can then be used in further actions within the playbook.
References:
FortiAnalyzer 7.4.1 documentation on playbook configurations, output variables, and data attachment functionalities.
What is the purpose of running the command diagnose sql status sqlreportd?
Options:
To view a list of scheduled reports
To list the current SQL processes running
To display the SQL query connections and hcache status
To identify the database log insertion status
Answer:
CExplanation:
The command diagnose sql status sqlreportd is used in FortiAnalyzer to obtain specific information about the SQL reporting process and caching status. Here’s what this command accomplishes and an analysis of each option:
Command Functionality:
sqlreportd is the FortiAnalyzer daemon responsible for managing SQL-based reporting processes.
The diagnose sql status sqlreportd command provides information on active SQL query connections and the hcache (historical cache) status, which helps in monitoring and troubleshooting SQL report generation.
Option Analysis:
Option A - To View a List of Scheduled Reports:
This option is incorrect because the command does not list scheduled reports. Instead, it focuses on SQL reporting processes and cache details.
Option B - To List the Current SQL Processes Running:
While the command may show active SQL connections, its primary focus is not a detailed list of all SQL processes but rather the connections and cache status for reporting.
Option C - To Display the SQL Query Connections and hcache Status:
This is correct. The command specifically provides information on SQL query connections related to the reporting process (sqlreportd) and displays the hcache status.
Option D - To Identify the Database Log Insertion Status:
This is incorrect. The command does not provide details on log insertion status. Log insertion status is typically monitored through different diagnostic commands focused on database processes and log handling.
Conclusion:
Correct Answer: C. To display the SQL query connections and hcache status
This command is used to monitor SQL reporting activities and cache status, aiding in the analysis of report generation performance and connection health.
References:
FortiAnalyzer 7.4.1 documentation on SQL diagnostic commands, particularly those related to reporting (sqlreportd) and caching mechanisms.
You are trying to configure a task in the playbook editor to run a report.
However, when you try to select the desired playbook, you do to see it listed.
What is the reason?
Options:
The report does not have auto-cache and extended log filtering enabled.
The playbook is currently running and will be available after it is finished.
You must create a trigger to run the report first.
The report has no result and must be reconfigured.
Answer:
AWhich log will generate an event with the status Contained?
Options:
An AV log with action=quarantine.
An IPS log with action=pass.
A WebFilter log will action=dropped.
An AppControl log with action=blocked.
Answer:
AExhibit.

What can you conclude about the output?
Options:
The message rate being lower that the log rate is normal.
Both messages and logs are almost finished indexing.
There are more traffic logs than event logs.
The output is ADOM specific
Answer:
AExplanation:
In this output, we see two diagnostic commands executed on a FortiAnalyzer device:
diagnose fortilogd lograte: This command shows the rate at which logs are being processed by the FortiAnalyzer in terms of log entries per second.
diagnose fortilogd msgrate: This command displays the message rate, or the rate at which individual messages are being processed.
The values provided in the exhibit output show:
Log rate (lograte): Consistently high, showing values such as 70.0, 132.1, and 133.3 logs per second over different time intervals.
Message rate (msgrate): Lower values, around 1.4 to 1.6 messages per second.
Explanation
Interpretation of log rate vs. message rate: In FortiAnalyzer, the log rate typically refers to the rate of logs being stored or indexed, while the message rate refers to individual messages within these logs. Given that a single log entry can contain multiple messages, it's common to see a lower message rate relative to the log rate.
Understanding normal operation: In this case, the message rate being lower than the log rate is expected and typical behavior. This discrepancy can arise because each log entry may bundle multiple related messages, reducing the message rate relative to the log rate.
Conclusion
Correct Answer: A. The message rate being lower than the log rate is normal.
This aligns with the normal operational behavior of FortiAnalyzer in processing logs and messages.
There is no indication that both logs and messages are nearly finished indexing, as that would typically show diminishing rates toward zero, which is not the case here. Additionally, there’s no information in this output about specific ADOMs or a comparison between traffic logs and event logs. Thus, options B, C, and D are incorrect.
References:
FortiOS 7.4.1 and FortiAnalyzer 7.4.1 command guides for diagnose fortilogd lograte and diagnose fortilogd msgrate.
Exhibit.
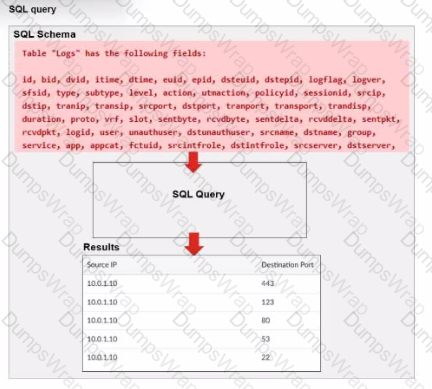
A fortiAnalyzer analyst is customizing a SQL query to use in a report.
Which SQL query should the analyst run to get the expected results?
A)

B)

C)

D)

Options:
Option A
Option B
Option C
Option D
Answer:
AExplanation:
The requirement here is to construct a SQL query that retrieves logs with specific fields, namely "Source IP" and "Destination Port," for entries where the source IP address matches 10.0.1.10. The correct syntax is essential for selecting, filtering, ordering, and grouping the results as shown in the expected outcome.
Analysis of the Options:
Option A Explanation:
SELECT srcip AS "Source IP", dstport AS "Destination Port": This syntax selects srcip and dstport, renaming them to "Source IP" and "Destination Port" respectively in the output.
FROM $log: Specifies the log table as the data source.
WHERE $filter AND srcip = '10.0.1.10': This line filters logs to only include entries with srcip equal to 10.0.1.10.
ORDER BY dstport DESC: Orders the results in descending order by dstport.
GROUP BY srcip, dstport: Groups results by srcip and dstport, which is valid SQL syntax.
This option meets all the requirements to get the expected results accurately.
Option B Explanation:
WHERE $filter AND Source IP != '10.0.1.10': Uses != instead of =. This would exclude logs from the specified IP 10.0.1.10, which is contrary to the expected result.
Option C Explanation:
The ORDER BY clause appears before the FROM clause, which is incorrect syntax. SQL requires the FROM clause to follow the SELECT clause directly.
Option D Explanation:
The GROUP BY clause should follow the FROM clause. However, here, it’s located after WHERE, making it syntactically incorrect.
Conclusion:
Correct Answer: A. Option A
This option aligns perfectly with standard SQL syntax and filters correctly for srcip = '10.0.1.10', while ordering and grouping as required.
References:
FortiAnalyzer 7.4.1 SQL query capabilities and syntax for report customization.
Which statement about automation connectors in FortiAnalyzer is true?
Options:
An ADOM with the Fabric type comes with multiple connectors configured.
The local connector becomes available after you configured any external connector.
The local connector becomes available after you connectors are displayed.
The actions available with FortiOS connectors are determined by automation rules configured on FortiGate.
Answer:
DWhich two statements about playbook execution are true? (Choose two)
Options:
FortiAnalyzer will not commit changes made by a Failed playbook
The Playbook Monitor provides troubleshooting logs
You can O Even I the playbook status is Failed, individual tasks may have succeeded.
Answer:
A, BWhich statement regarding macros on FortiAnalyzer is true?
Options:
Macros are predefined templates for reports and cannot be customized.
Macros are useful in generating excel log files automatically based on the report settings.
Macros are ADOM-specific and each ADOM type have unique macros relevant to that ADOM.
Macros are supported only on the FortiGate ADOMs.
Answer:
BExplanation:
Macros in FortiAnalyzer are used to streamline reporting tasks by automating data extraction and report generation. Here’s a breakdown of each option to determine the correct answer:
Option A - Macros are Predefined Templates for Reports and Cannot be Customized:
This statement is incorrect. Macros in FortiAnalyzer are not simply fixed templates; they allow for customization to tailor data extraction and reporting based on specific needs and configurations.
Conclusion: Incorrect.
Option B - Macros are Useful in Generating Excel Log Files Automatically Based on the Report Settings:
This statement is accurate. Macros in FortiAnalyzer can be configured to automate the generation of reports, including outputting log data to Excel format based on predefined report settings. This makes them especially useful for scheduled reporting and data analysis.
Conclusion: Correct.
Option C - Macros are ADOM-Specific and Each ADOM Type Has Unique Macros Relevant to that ADOM:
Macros are not limited to specific ADOMs, nor are they ADOM-specific. Macros can be applied across various ADOMs based on report configurations but are not inherently tied to or unique for each ADOM type.
Conclusion: Incorrect.
Option D - Macros are Supported Only on the FortiGate ADOMs:
This is not true. Macros in FortiAnalyzer are not restricted to FortiGate ADOMs; they can be utilized across different ADOMs that FortiAnalyzer manages.
Conclusion: Incorrect.
Conclusion:
Correct Answer: B. Macros are useful in generating excel log files automatically based on the report settings.
This answer correctly describes the functionality of macros in FortiAnalyzer, emphasizing their role in automating report generation, especially for Excel log files.
References:
FortiAnalyzer 7.4.1 documentation on macros and report generation functionalities.
Which log will generate an event with the status Unhandled?
Options:
An AV log with action=quarantine.
An IPS log with action=pass.
A WebFilter log will action=dropped.
An AppControl log with action=blocked.
Answer:
BExplanation:
In FortiOS 7.4.1 and FortiAnalyzer 7.4.1, the "Unhandled" status in logs typically signifies that the FortiGate encountered a security event but did not take any specific action to block or alter it. This usually occurs in the context of Intrusion Prevention System (IPS) logs.
IPS logs with action=pass: When the IPS engine inspects traffic and determines that it does not match any known attack signatures or violate any configured policies, it assigns the action "pass". Since no action is taken to block or modify this traffic, the status is logged as "Unhandled."
Let's look at why the other options are incorrect:
An AV log with action=quarantine: Antivirus (AV) logs with the action "quarantine" indicate that a file was detected as malicious and moved to quarantine. This is a definitive action, so the status wouldn't be "Unhandled."
A WebFilter log will action=dropped: WebFilter logs with the action "dropped" indicate that web traffic was blocked according to the configured web filtering policies. Again, this is a specific action taken, not an "Unhandled" event.
An AppControl log with action=blocked: Application Control logs with the action "blocked" mean that an application was denied access based on the defined application control rules. This is also a clear action, not "Unhandled."
Which statement describes archive logs on FortiAnalyzer?
Options:
Logs that are indexed and stored in the SQL database
Logs a FortiAnalyzer administrator can access in FortiView
Logs compressed and saved in files with the .gz extension
Logs previously collected from devices that are offline
Answer:
CExplanation:
In FortiAnalyzer, archive logs refer to logs that have been compressed and stored to save space. This process involves compressing the raw log files into the .gz format, which is a common compression format used in Fortinet systems for archived data. Archiving is essential in FortiAnalyzer to optimize storage and manage long-term retention of logs without impacting performance.
Let’s examine each option for clarity:
Option A: Logs that are indexed and stored in the SQL database
This is incorrect. While some logs are indexed and stored in an SQL database for quick access and searchability, these are not classified as archive logs. Archived logs are typically moved out of the database and compressed.
Option B: Logs a FortiAnalyzer administrator can access in FortiView
This is incorrect because FortiView primarily accesses logs that are active and indexed, not archived logs. Archived logs are stored for long-term retention but are not readily available for immediate analysis in FortiView.
Option C: Logs compressed and saved in files with the .gz extension
This is correct. Archive logs on FortiAnalyzer are stored in compressed .gz files to reduce space usage. This archived format is used for logs that are no longer immediately needed in the SQL database but are retained for historical or compliance purposes.
Option D: Logs previously collected from devices that are offline
This is incorrect. Although archived logs may include data from devices that are no longer online, this is not a defining characteristic of archive logs.
References: FortiAnalyzer 7.4.1 documentation and configuration guides outline that archived logs are stored in compressed files with the .gz extension to conserve storage space, ensuring FortiAnalyzer can handle a larger volume of logs over extended periods.
Exhibit.
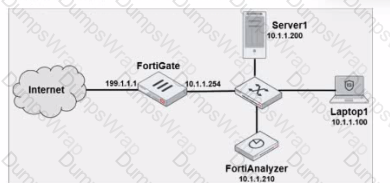
Laptop1 is used by several administrators to manage FotiAnalyzer. You want to configure a generic text filter that matches all login attempts to the web interface generated by any user other than admin’’, and coming from Laptop1.
Which filter will achieve the desired result?
Options:
Operation-login and performed_on==’’GUI(10.1.1.100)’ and user!=admin
Operation-login and performed_on==’’GU (10.1.1.120)’ and user!=admin
Operation-login and srcip== 10.1.1.100 and dstip==10.1.1.1.210 and user==admin
Operation-login and dstip==10.1.1.210 and user!-admin
Answer:
AExplanation:
The objective is to create a filter that identifies all login attempts to the FortiAnalyzer web interface (GUI) coming from Laptop1 (IP 10.1.1.100) and excludes the admin user. This filter should match any user other than admin.
Filter Components Analysis:
Operation-login: This portion of the filter will target login actions specifically, which is correct for filtering login attempts.
performed_on==’’GUI(10.1.1.100)’: This indicates that the login attempt must occur on the GUI interface and originate from the specified IP, which matches Laptop1's IP address (10.1.1.100). This ensures that the filter only matches GUI logins from this specific device.
user!=admin: This part excludes logins by the admin user, meeting the requirement to capture only non-admin users.
Option Analysis:
Option A: Correctly specifies the Operation-login, performed_on==’’GUI(10.1.1.100)’, and user!=admin. This setup effectively filters login attempts to the GUI from Laptop1, excluding the admin user.
Option B: Uses the incorrect IP 10.1.1.120 in the performed_on filter, which does not match Laptop1's IP (10.1.1.100).
Option C: This option includes srcip==10.1.1.100 and dstip==10.1.1.210 but incorrectly specifies user==admin instead of user!=admin, which does not match the requirement to exclude admin users.
Option D: This option does not specify the performed_on field to restrict it to the GUI and only includes dstip (destination IP) without srcip. It also incorrectly uses user!-admin instead of the correct syntax user!=admin.
Conclusion:
Correct Answer: A. Operation-login and performed_on==’’GUI(10.1.1.100)’ and user!=admin
This filter precisely captures the required conditions: login attempts from Laptop1 to the GUI interface by any user except admin.
References:
FortiAnalyzer 7.4.1 documentation on log filters, syntax for login operations, and GUI login tracking.
Exhibit.
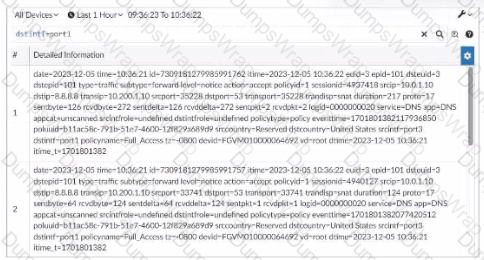
What can you conclude about these search results? (Choose two.)
Options:
They can be downloaded to a file.
They are sortable by columns and customizable.
They are not available for analysis in FortiView.
They were searched by using text mode.
Answer:
A, DExplanation:
In this exhibit, we observe a search query on the FortiAnalyzer interface displaying log data with details about the connection events, including fields like date, srcip, dstip, service, and dstintf. This setup allows for several functionalities within FortiAnalyzer.
Option A - Download Capability:
FortiAnalyzer provides the option to download search results and reports to a file in multiple formats, such as CSV or PDF, allowing for further offline analysis or archival. This makes it possible to save the search results shown in the exhibit to a file.
Conclusion: Correct.
Option B - Sorting and Customization:
The FortiAnalyzer interface allows users to sort and customize columns for search results. This helps in organizing and viewing the logs in a manner that fits the analyst's needs, such as ordering logs by time, srcip, dstip, or other fields.
Conclusion: Correct.
Option C - Availability in FortiView:
FortiView is a tool within FortiAnalyzer that visualizes data and provides analysis capabilities, including traffic and security event logs. Since these are traffic logs, they are typically available for visualization and analysis within FortiView.
Conclusion: Incorrect.
Option D - Text Mode Search:
The search displayed here appears to be in a structured format, which implies it might be utilizing filters rather than a free-text search. FortiAnalyzer allows both structured searches and text searches, but there's no indication here that text mode was used.
Conclusion: Incorrect.
Conclusion:
Correct Answer: A. They can be downloaded to a file. and B. They are sortable by columns and customizable.
These options are consistent with FortiAnalyzer's capabilities for managing, exporting, and customizing log data.
References:
FortiAnalyzer 7.4.1 documentation on search, export functionalities, and customizable views.
Which statement about exporting items in Report Definitions is true?
Options:
Templates can be exported.
Template exports contain associated charts and datasets.
Chart exports contain associated datasets.
Datasets can be exported.
Answer:
BWhat are two effects of enabling auto-cache in a FortiAnalyzer report? (Choose two.)
Options:
The generation time for reports is decreased.
When new logs are received, the hard-cache data is updated automatically.
FortiAnalyzer local cache is used to store generated reports.
The size of newly generated reports is optimized to conserve disk space.
Answer:
A, CExplanation:
Enabling auto-cache in FortiAnalyzer reports is designed to improve the efficiency and speed of report generation by leveraging cached data. Let’s analyze each option to determine which effects are correct.
Option A - The Generation Time for Reports is Decreased:
When auto-cache is enabled, FortiAnalyzer can use previously cached data instead of reprocessing all log data from scratch each time a report is generated. This results in faster report generation times, especially for recurring reports that use similar datasets.
Conclusion: Correct.
Option B - Hard-Cache Data is Automatically Updated When New Logs are Received:
Enabling auto-cache does not immediately update the cache with every new log received. Instead, the cache is updated when reports are generated, based on the existing logs up to that point. Therefore, auto-cache does not constantly refresh with each incoming log, which would be inefficient.
Conclusion: Incorrect.
Option C - FortiAnalyzer Local Cache is Used to Store Generated Reports:
Auto-cache utilizes FortiAnalyzer’s local cache to store data used in reports, reducing the need to retrieve and process logs repeatedly. This cached data can be reused for subsequent report generation, enhancing performance.
Conclusion: Correct.
Option D - The Size of Newly Generated Reports is Optimized to Conserve Disk Space:
Auto-cache does not directly impact the size of the report files themselves. It focuses on performance optimization through cached data for faster access, but it does not compress or optimize the storage size of the generated report.
Conclusion: Incorrect.
Conclusion:
Correct Answer: A. The generation time for reports is decreased and C. FortiAnalyzer local cache is used to store generated reports.
Enabling auto-cache helps reduce report generation time by using locally cached data and optimizes report processing, though it does not impact report size or continuously update with each new log.
References:
FortiAnalyzer 7.4.1 documentation on report caching, auto-cache functionality, and report generation optimizations.

